


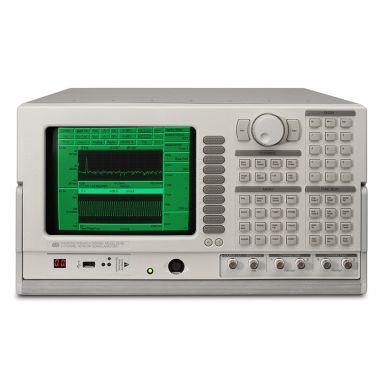
SRS SR785 Dynamic Signal Analyser

- DC to 102.4 kHz Bandwidth
- 90 dB dynamic range
- 16-bit A/D conversion
- Low distortion synthesized source
- ANSI standard octave measurements
- 145 dB dynamic range swept sine mode
Lambda Exclusive Promotion:
Additional 12 months warranty for free (2 years total) via our UK Service Centre.
The Stanford Research Systems SR785 Two Channel Dynamic Signal Analyser is a precision, full-featured signal analyser that offers state-of-the-art performance anda wide selection of features at a price that's less than half that of competitive analysers. Building on its predecessor, the SRS SR780, the SR785 incorporates new firmware and hardware that make it the ideal instrument for analyzing both mechanical and electrical systems. For measurements involving modal analysis, machinery diagnostics, vibration testing, servo systems, control systems, or acoustics, the SR785 has the features and specifications to get the job done.
A unique measurement architecture allows the SR785 to function as a typical dual channel analyser with measurements like cross spectrum, frequency response, coherence, etc. Alternatively, the instrument can be configured so that each input channel functions as a single channel analyser with its own span, center frequency, resolution and averaging. This allows you to view a wideband spectrum and simultaneously zoom in on spectral details. The same advanced architecture provides storage of all measurement building blocks and averaging modes. Vector averaged, RM Saveraged, unaveraged and peak hold versions of all measurements are simultaneously acquired and can be displayed without re-taking data.
Standard measurement groups include FFT, order tracking, octave, swept-sine, correlation, time capture and time/histogram. The SR785 brings the power of several instruments to your application: a spectrum analyser, network analyser, vibration analyser, octave analyser and oscilloscope.
The SR785 comes equipped with a wide selection of averaging techniques to improve your signal to noise ratio. Choose RMS averaging to reduce signal fluctuations, vector averaging to actually eliminate noise from synchronous signals, or peak hold averaging. In the order-tracking measurement group, time averaging is available. Both linear and exponential averaging are provided for each mode.
Because the SR785 is so fast, there's no need for a separate "fast averaging" mode. For instance, in a full span FFT measurement with a 4 ms time record, 1000 averages take exactly 4 seconds, during which the SR785 still operates at its maximum display rate.
For impact testing, the average preview feature allows each time record or spectrum to be accepted or rejected before adding it to the measurement.
Order Tracking
Order tracking is used to evaluate the behavior of rotating machinery. Measurement data is displayed as a function of multiples of the shaft frequency (orders), rather than absolute frequency. Combined with a waterfall plot, the SR785 provides a complete history or "order map" ofyour data as a function of time or RPM. Using the slice feature, the amplitude profile of specific orders in the map can be analysed.
In tracked order mode the intensity of individual orders vs. RPM is measured. Unlike other analysers, there's no need to track a limited number of orders to ensure full speed measurements. The SR785's speed allows simultaneous tracking of up to 400 orders.
Run-up and run-down measurements are available in both polar and magnitude/phase formats. RPM profiling is provided to monitor variations of RPM as a function of time. A complete selection of time and RPM triggering modes is included allowing you to make virtually any rotating machinery measurement.
Octave Analysis
Real-time 1/1, 1/3, 1/12 octave analysis at frequencies up to 40 kHz(single channel), or 20 kHz (2 channel) is a standard feature of the SR785. Octave analysis is fully compliant with ANSI S1.11-1986 (Order 3,type 1-D) and IEC 225-1966. Switchable analog A-weighting filters as well as A, B and C weighting math functions are included. Averaging choices include exponential time averaging, linear time averaging, peak hold andequal confidence averaging. Broadband sound level is measured and displayed as the last band in the octave graph. Total power, impulse, peak hold and Leq are all available. Exponentially averaged sound power (Leq)is calculated according to ANSI S1.4-1983, Type 0.
Octave displays can be plotted as waterfalls with a fast 4 ms storageinterval. Once data is stored in the waterfall buffer, the SR785 candisplay centile exceedance statistics for each 1/1, 1/3 or 1/12 octaveband as well as for Leq.
Swept-Sine Measurements
Swept-sine mode is ideal for signal analysis that involves high dynamic range or wide frequency spans. Gain is optimised at each point in the measurement producing up to 145 dB of dynamic range. A frequencyresolution of up to 2000 points is also provided. Auto-ranging can be used with source auto-leveling to maintain a constant input or output level at the device under test (to test response at a specific amplitude, forinstance).
Auto-resolution ensures the fastest possible sweeps and adjusts the frequency steps in the scan based on the DUT's response. Phase andamplitude changes that exceed user-defined thresholds are measured with high frequency resolution, while small changes are measured using wider frequency steps between points. A choice of linear sweeps with high resolution, or logarithmic sweeps with up to eight decades of frequency range is provided.
Time/Histogram
Use the time/histogram measurement group to analyse time domain data. A histogram of the time data vs. signal amplitude is provided for accurate time domain signal characterisation. Statistical analysis capabilities include both probability density function (PDF) and cumulative density function (CDF). The sample rate, number of samples and number of bins can all be adjusted.
Time Capture
The SR785 comes with 2 M samples of memory (8 M samples optional). Analog waveforms can be captured at sampling rates of 262 kHz or any binary submultiple, allowing you to optimiae sampling rate and storage for any application. For example, 8 M samples of memory will capture 32 seconds of time domain data at the maximum 262 kHz sample rate, or about 9 hours of data at a 256 Hz sample rate. Once captured, any portion of the signal canbe played back in any of the SR785's measurement groups except swept-sine.The convenient Auto Pan feature lets you display measurement results synchronously with the corresponding portion of the capture buffer toidentify important features.
Unit Conversion
Automatic unit conversion makes translating transducer data easy. Enter your transducer conversion directly in V/EU, EU/V or dB (1V/EU). TheSR785 will display the result in units of meters, inches, m/sec2, in/sec2,m/s, in/s, mil, g, kg, lbs., N, dynes, pascals or bars. Built-in ICP power means you don't need an external power supply for your accelerometer.Acoustic measurement results can be displayed in dBSPL, while electrical units include V, V², dBV and dBm.
Source Types
The SR785 comes standard with five precision source types. Generate low distortion (-80 dBc) single or two-tone sine waves, white noise, pink noise, chirps, and arbitrary waveforms. The chirp and noise sources can be bursted to provide activity over a selected portion of the time record for FFT measurements, or to provide impulse noise for acoustic measurements.The digitally synthesised source produces output levels from 0.1 mV to 5 Vand offsets from 0 to ±5 V, and delivers up to 100 mA of current.
Arbitrary waveform capability is standard with the SR785. Use the arbitrary source to playback a section of a captured waveform, play aselected FFT time record or upload your own custom waveform from your computer.
User Math
Create your own measurement in each of the SR785's measurement groups using the math menu. Enter any equation involving RMS averaged, vector averaged or unaveraged time or frequency data, stored files, constants, or a rich array of supplied operations including arithmetic functions, FFT, inverse FFT, jw, d/dw, exp, ln x, and many others. Because all the averaging modes are available as user math operands, non-repeatable runout measurements (used in analysing disk drives) can be performed in a singlepass by entering the equation MAG(RMS)-MAG(Vec). Unlike many other analysers, the SR785's measurement rate is virtually unaffected when user math is selected. For instance, the function exp(ln(conj(FFT2/FFT1))) can be calculated with a 100 kHz real-time bandwidth.
Waterfall
Waterfall plots are a convenient way of viewing a time history of your data. Each successive measurement record is plotted along the z-axis making it easy to see trends in the data. All FFT, octave and ordertracking measurements can be stored in the SR785's waterfall buffer memory. You can choose to save all measurements and averaging modes or just the current measurement to conserve memory. Waterfall traces can bestored every n time records for FFT and order tracking measurements. For order tracking measurements new records can be acquired at a specific time interval or change in RPM. In octave measurements, the storage interval is in seconds (as fast as every 4 ms). While displaying waterfall plots, you can adjust the skew angle to reveal important features, or change the baseline threshold to eliminate low-level clutter. Any z-axis slice orx-axis record can be saved to disk or displayed separately for analysis.
Analysis
The SR785 includes a wide variety of built-in analysis features. Marker analysis lets you easily measure the power contained in harmonics, sidebands or within a given band of frequencies. Important information such as THD, THD+N, sideband power relative to a carrier, or total integrated power are calculated in real-time and displayed on the screen.The front/back display feature allows you to display live data from bothsignal inputs on one graph. You can also simultaneously display saved traces and live data. The peak-find marker allows you to quickly locatef requency peaks with the click of a button. The marker statistics feature calculates the maximum, minimum, mean and standard deviation of data in any section of the display. For modal analysis, the cursor can be configured to display the resonant frequency and damping of a single selected mode.
Use data tables to display up to 100 selected data points in tabular format. Limit tables allow you to define up to 100 upper and lower limit segments in each display for GO/NO GO testing. Data and limit table definitions can also be saved to and recalled from disk for quick setup.
Curve Fit and Synthesis
The SR785 has a standard 20-pole, 20-zero curve fitter that can fit frequency domain data from both the FFT and swept-sine measurement groups.Curve models can be displayed in pole/zero, pole/residue and polynomial formats. Synthesis reverses the process: enter a model in any of the above formats and the SR785 synthesises the required curve. The curvefit/synthesis menu allows you to change gain, delay and frequency scale,set pole and zero locations and instantly see the response of the modeledsystem.
Output
The SR785's built-in 3.5" 1.44 MB disk drive, GPIB and RS-232 computer interfaces and Centronics printer port combine to allow almost unlimited flexibility in saving, printing, plotting or exporting your measurementdata. Displays and setups can be printed or plotted to disk, GPIB, RS-232 or Centronics port in PCX, GIF, PCL (LaserJet® and DeskJet®), dot-matrix,Postscript, HP-GL or ASCII formats. An annotation editor lets you addtext, time and date, or filenames to any portion of the plot. For modal analysis applications, nodal degree-of-freedom information is stored with the data files to simplify transfer to external analysis programs.
Data
The SR785 contains a complete suite of data conversion utilities for both Windows® and DOS® operating systems. These versatile utilities make data transfer to and from external programs fast and simple. SR785 files can be converted to ASCII for use with spreadsheets, or Universal File Format(UFF) and HP SDF for use with modal analysis programs. SR785 Files can also be converted to MAT file format for use with MATLAB. Conversion from external file types is also supported. Both HP SDF and SR780 files can beconverted to SR785 format.
DataViewer
The SRS DataViewer is a Windows 95 program that allows you to quickly upload SR785 files into a graphical environment, perform simple editingand cut and paste into other applications. You can add pointers and text, change scaling and perform simple math operations. Graphs can be saved in PCX, BMP or GIF formats.
![]() Stanford Research Systems SR785 datasheet
Stanford Research Systems SR785 datasheet
![]() About FFT Spectrum Analyzers Applications Note
About FFT Spectrum Analyzers Applications Note
![]() Why buying from Lambda makes sense
Why buying from Lambda makes sense
| Photo | Product | Price | |
|---|---|---|---|
 | SRS SR770 FFT Spectrum Analyser | > | |
 | SRS SR780 Two Channel Dynamic Signal Analyser | > |