


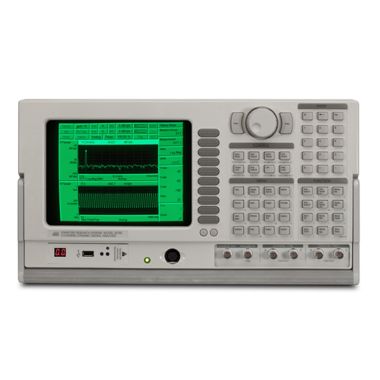
SRS SR780 Two Channel Dynamic Signal Analyser

- 102.4 kHz frequency range on both channels
- 90 dB dynamic range (FFT mode)
- 145 dB dynamic range (swept sine mode)
- 102.4 kHz real-time bandwidth
- Display two different frequency spans
- Real-time ANSI standard octave analysis (1/1, 1/3, and 1/12 octave)
- Low distortion sine source (-90 dBc) plus two-tone, chirp, noise, burst and arbitrary
- 2 Msample memory (8 Msample optional) for time capture, waterfall plots and arbitrary source
- Postscript, PCX, GIF and HP-GL output
Lambda Exclusive Promotion:
Additional 12 months warranty for free (2 years total) via our UK Service Centre.
An FFT network analyser that combines high performance, low cost, and all the features you need without forcing you to buy an array of expensive options. The Stanford Research Systems (SRS) SR780 offers it all: 102.4 kHz dual channel FFTs with 90 dB dynamic range, 145 dB dynamic range swept-sine measurements, real time ANSI standard octave analysis, waterfalls, transient capture, and more, for less than half the cost of other similarly equipped analysers.
The SR780's advanced architecture gives you two analyzers in one box. You can configure each display with separate spans, centre frequencies, or averaging configurations. The "link" key lets you change parameters for both displays together or separately with a single key press.
Whether your application involves acoustic measurements, vibration testing, servo systems, or filter design, the SR780's features, performance, and low cost make it the overwhelming choice in FFT network analysers.
Full, context-sensitive help screens for all SR780 features mean you will rarely have to refer to a printed manual. Hypertext links let you quickly switch between related help pages or instantly reference the remote command corresponding to any SR780 function. Use the help index to quickly locate help on any topic, jump to the online troubleshooting guide, browse a complete listing of the SR780's specifications, or examine a comprehensive description the SR780's remote commands... all from the front panel.
The SR780 includes a wide variety of built-in analysis features. Marker analysis lets you use the marker to easily measure the power contained in the harmonics, sidebands or within a given band of a frequency domain measurement. Important signal information such as THD, THD+N, sideband power relative to carrier, and total integrated power are calculated in real time and displayed on the screen. Marker statistics quickly calculate the maximum, minimum, mean, and standard deviation of data at any point inthe display.
The SR780 delivers true 2-channel 102.4 kHz FFT performance. Unlike other analysers, the SR780 doesn't make you sacrifice 2-channel performance for bandwidth - its fast 32-bit floating point DSP processor gives the SR780 a fast 102.4 kHz real time rate with both channels selected. Two precision 16-bit ADCs provide a 90 dB typical dynamic range in FFT mode - enough for the most demanding low-level measurements. Selectable 100 to 800 line analysis optimizes time and frequency resolution and you can zoom in on any portion of the 102.4 kHz range with a frequency span down to 191 mHz.
The SR780's unique architecture lets the two displays function as separate analysers. You can choose separate frequency spans, starting frequencies, number of FFT lines, or averaging modes for each display. So it's no problem to look at a wideband display and zoom in on a specific feature simultaneously. No other spectrum analyser lets you select from two sampling rates: 256 kHz or 262 kHz, so frequency spans come out in eithera binary (102.4 KHz, 51.2 kHz,...) or decimal (100 kHz, 50 kHz, 25kHz,...) sequence depending on your requirements.
Real time octave analysis at frequencies up to 40 kHz (single channel), or 20 kHz (2-channel) is standard on the SR780. Octave analysis is fully compliant with ANSI S1.11-1986 (Order 3, type 1-D) and IEC 225-1966. 1/1 octave, 1/3 octave, and 1/12 octave analysis are all available. Switchable analog A-weighting filters as well as built-in user math A, B, and C-weighting functions are all included. Octave averaging choices include exponential time averaging, linear time averaging, peak hold, and equal confidence averaging. IEC 651 Type 0 compliant peak hold, impulse, fast,and slow sound level measurements are all calculated.
Swept-Sine Analysis
Swept-sine analysis for measurements involving high dynamic range or wide frequency intervals is also a standard feature of the SR780. Selectable auto-ranging optimizes the input range at each point in the measurement, providing up to 145 dB of dynamic range. Auto-ranging can be used with source auto-leveling to maintain a constant input or output level at the device under test. To ensure the fastest sweeps possible, auto-resolution can also be selected, providing a variable scan speed tailored precisely to the signal being measured. Choose linear sweeps for high frequency resolution or logarithmic sweeps up to 8 decades for the widest frequency coverage.
Averaging
Enough averaging choices are provided for any measurement. Choose rms averaging to reduce signal fluctuations, or vector averaging to actually eliminate noise from synchronous signals. Choose linear averaging (stable averaging) for fixed signals, or exponential averaging to track drifting features. Because the SR780's 102.4 kHz real time bandwidth lets it take data seamlessly, vector averaging can be selected for any signal that's repetitive within the time record - no trigger is necessary.
Measurements
Automatic unit conversion makes translating accelerometer data easy. Enter your accelerometer conversion directly in V/EU, EU/V or dB(1V/EU). The SR780 will display results in units of meters, inches, mil, g, kg, lbs, N ,dynes, pascals, bars, or dB SPL. Accelerometer data is automatically converted to velocity or displacement units. Built-in ICP power means you won't have to take along an external power supply for your accelerometer.
Arbitrary waveform capability is standard on the SR780. Use the arbitrary source to playback a section of a captured waveform, play a selected FFT time record, or upload your own custom waveform from disk or over the remote interface.
User Math
All three measurement groups: FFT, octave, and swept-sine, allow you to create your own measurement using the SR780's user math menu. Enter any equation involving time or frequency data, stored files, constants, or arich array of supplied operations including the arithmetic functions, FFT,inverse FFT, jw, d/dw, exp, ln x and many others. Unlike many analyzers,the SR780 doesn't slow to a snail's pace when user math is selected. For instance, the function exp(ln(conj(Average(FFT2/FFT1))) can be calculated with a 50 kHz real time bandwidth.
Source
Choose from one of 5 precision source types: low distortion (-80 dBc) single or two-tone sine waves, chirps, white noise, pink noise, or arbitrary waveforms. The chirp and noise sources can both be bursted to provide a source that's active only over a selected portion of the time record for FFT measurements, or to provide an impulsive noise source for acoustic measurements. The digitally synthesized source provides output levels from 0.1 mV to 5 V and delivers up to 100 mA of current.
Capture
The SR780 comes with 2 M samples of standard capture memory. Waveforms can be captured at 262 kHz or any sub multiple of 262 kHz, allowing you to select the sample rate and capture length that's right for your data. Once captured, any portion of the signal can be played back in any FFT or octave measurement. The convenient "AutoPan" feature lets you display the measurement results synchronously with the corresponding portion of the capture buffer to easily identify important features. Optional memory expansion modules lets you expand the SR780's capture depth to up to 8M samples - that's almost 30 seconds of capture at the maximum sampling rate.
Waterfall
All octave and FFT measurements can be stored in the SR780's two 2k deep waterfall buffers. Waterfall storage is selectable as every n time records for FFT measurements, or you can select a storage interval in seconds (down to 4 ms) for octave measurements. While displaying waterfalls, you can adjust the skew angle to reveal important features, or change the baseline threshold to eliminate low-level clutter. Any z-axis slice orx-axis record can be saved to disk or displayed separately for individual analysis.
Analysis
Use data tables to display up to 100 selected data points in a tabular format. Limit tables allow you to define up to 100 upper and lower limit segments in each display for GO/NO GO testing. Data and limit table definitions can also be saved and recalled from disk for quick setup.
For sound level measurements, centile exceedance statistics are automatically calculated for each 1/1,1/3, or 1/12 octave band as well for Leq.
Output
The SR780's built in 3.5" 1.44 MB floppy disk, IEEE-488 and RS232 interface ports, and Centronics printer port combine to allow almost unlimited flexibility in saving, printing, plotting, or exporting your measurement data. Annotated displays can be printed or plotted to the disk, IEEE-488, RS232, or Centronics port in PCX, GIF, PCL (HP LaserJet and DeskJet), dot-matrix, Postscript, HP-GL or ASCII formats. User generated ASCII files can also be imported with a single keystroke allowing you to create your own displays for use in math functions or to compare with live data. Utilities are even included to convert your HP SDF files to SR780 format.
![]() Stanford Research Systems SR780 datasheet
Stanford Research Systems SR780 datasheet
![]() About FFT Spectrum Analyzers Applications Note
About FFT Spectrum Analyzers Applications Note
![]() Why buying from Lambda makes sense
Why buying from Lambda makes sense
| Photo | Product | Price | |
|---|---|---|---|
 | SRS SR770 FFT Spectrum Analyser | > | |
 | SRS SR785 Dynamic Signal Analyser | > |