

Authors:
James Skinner & Nick Ridler, National Physical Laboratory
Nils Nazoa, LA Techniques Ltd
Mark Ashcroft, Pico Technology
Abstract
These days, many instrument calibrations are performed automatically – for example, using electronic calibration units. This includes calibration of vector network analysers (VNAs) where the calibration standards are generated electronically rather than using mechanical devices. However, verifying performance – particularly accuracy – of these electronic units is more difficult due to the “black box” nature of these devices. This paper describes a benchmarking exercise of a new-to-market electronic calibration unit, designed specifically for use with a portable USB-driven VNA. This includes a comparison of performance with mechanical calibration kits, and a comparison with the most accurate measurements available, obtained using primary national standards.
Introduction
One of the most important measuring instruments found in nearly all radio frequency (RF) and microwave test and measurement laboratories is the vector network analyser (VNA). These instruments can provide full characterization of most types of RF and microwave devices. In recent years, there has been much interest in developing USB-driven VNAs [1] to provide the portability, convenience and potentially cost advantages that are desirable in many measurement situations. However, calibration of VNAs is a necessary step toward achieving measurements with any degree of accuracy [2]. Traditional calibration methods involve the use of mechanical standards such as short-circuits, open-circuits and matched-loads. These are not always easy to implement, are tedious to connect and the process sequence is prone to errors. This has led to the development of electronic calibration methods [3] which are easier to implement, and provide a very quick and highly repeatable calibration process.

An example of an electronic calibration method for USB-driven VNAs is Pico Technology’s E-Cal unit– this combines the convenience and portability of the VNA with easy and reliable calibration [4]. The challenge is now to validate these electronic calibration units by checking their performance against other more well-established techniques. This paper presents the outcomes for two such benchmarking assessments: (i) a comparison with results obtained using conventional mechanical calibration kits; (ii) a comparison with the UK’s primary national standard capability, which provides internationally recognized measurements at the very highest levels of accuracy [5].
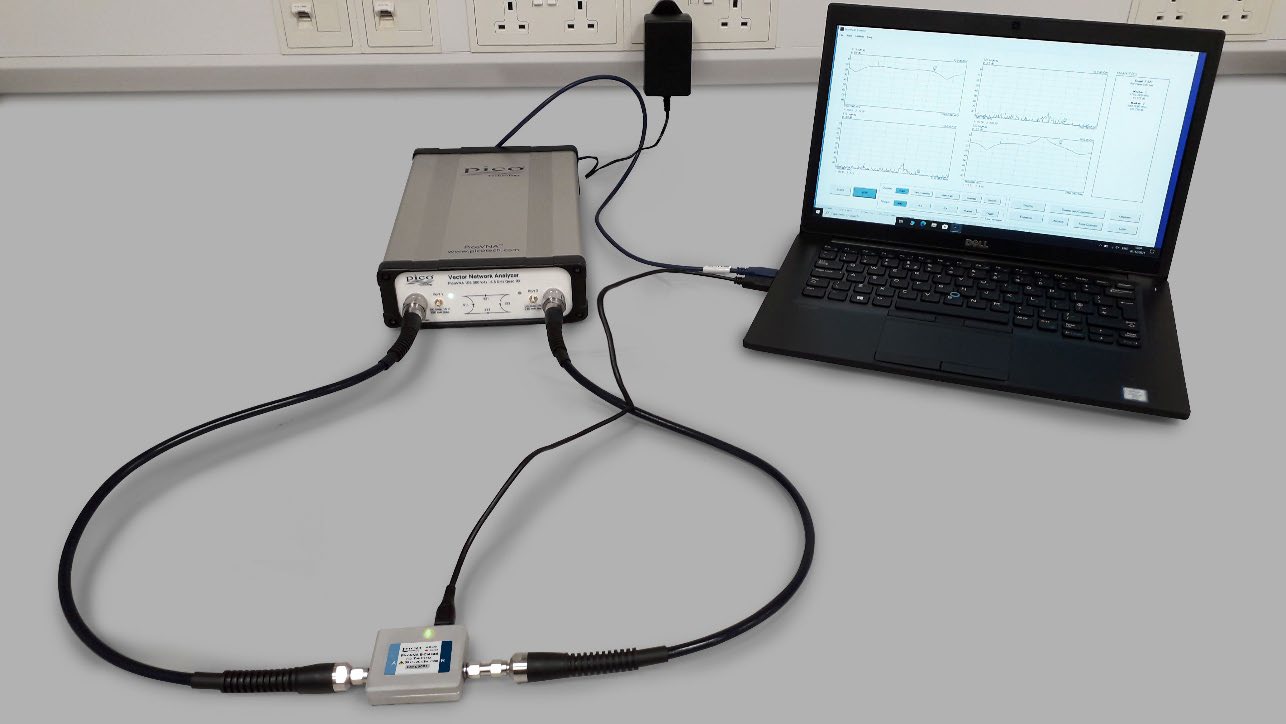
The VNA chosen for this assessment is the latest VNA from Pico Technology – the PicoVNA 108, which operates from 300 kHz to 8.5 GHz. Several different calibration methods are available for this VNA, including Short-Open-Load-Thru (SOLT), Thru-Reflect-Line (TRL), Unknown-Thru, and now electronic calibration (E-Cal). Figure 1 shows a PicoVNA 108 connected via a USB cable to a laptop (used for controlling the VNA and displaying the results), with two RF test port cables connected to an E-Cal unit. These are Pico’s “Standard” grade N-SMA cables and therefore the results produced indicate how the E-Cal unit will perform in a typical industrial lab set-up (rather than in, say, a high precision metrology environment).
The Pico Technology E-Cal unit is a 2-port device fitted with female (optional male) SMA connectors. It is supplied with a male-to-male and a fully characterized SMA adaptor which can be connected to one of the ports to change the gender configuration of the unit. For the purposes of the measurements presented in this paper, this adaptor was fitted to port 2 of the unit to allow for insertable connections, with port 1 being female and port 2 now being male.
The E-Cal unit connects to the laptop via USB connection. In the software’s cal kit editor the cal kit definitions for the unit can be loaded in automatically through the ‘Electronic Cal Kit’ menu.
Mechanical versus electronic calibration
The first assessment performed on the PicoVNA 108 was a comparison of measurements made after calibrating the VNA using three different methods: (i) a SOLT calibration using Pico Technology mechanical cal kits; (ii) a SOLT calibration using another manufacturer’s mechanical cal kit (on this occasion, an HP 85052C cal kit); (iii) an electronic calibration, using a Pico E-Cal unit. In all cases Port 1 of the VNA was fitted with a Type-N (male) to SMA (male) cable, and Port 2 was fitted with a Type-N (male) to SMA (female) cable. The calibration was controlled using the PicoVNA software. The instrument settings (such as frequency list and IF bandwidth) varied depending on the device being measured. This will be discussed later.
Calibrated by the manufacturer, the Pico Technology mechanical calibration kits contain each of the standards (either male or female) necessary for an SOLT calibration. The kit used to calibrate port 1 was a female SMA SOLT kit. The kit used to calibrate port 2 was a male SMA SOLT kit. The HP 85052C 3.5 mm calibration kit contains separate 1-port standards, both male and female, necessary for an SOLT calibration. The calibration kit definitions provided by the manufacturer (e.g. the offset lengths and losses of the standards, the capacitances of the open-circuits and the inductances of the short-circuits) were entered into the cal kit editor in the software. The Pico E-Cal unit, again with a standard manufacturer’s calibration, contains all the necessary (electronically switched) components to perform a full PicoVNA calibration. The calibration is achieved by simply connecting the E-Cal unit
between the VNA’s two test ports and selecting the E-Cal option from the calibration menu in the VNA software.
The first DUT (device under test) for this comparison was a Pico Technology check standard, shown in figure 2. It is a 2-port insertable (male to female) device fitted with SMA connectors. It is effectively a non-50 ohm (nominal 25 Ω) mismatch line which produces an interesting response, placing high stress on calibration quality in this kind of measurement comparison exercise.
For measurement of this device, the frequency settings were a start frequency of 500 MHz, a stop frequency of 8500 MHz and 201 measurement points. The resultant frequency step was 40 MHz and the IF Bandwidth was set to 100 Hz. Once calibration was complete the device was connected with its female end connected to Port 1 of the PicoVNA and its male end to Port 2.
The S11 and S21 results of the measurements utilising each of the three calibration schemes are all shown in Figure 3. The vertical axis appropriate for each trace is shown using arrows. It can be seen that there is very good agreement between the results produced by the three calibration schemes for both the transmission and reflection parameters.
The second DUT for this comparison was a band-pass filter. The model used was an A1 Microwave PB 1025 IB Band-Pass Filter as shown in Figure 4. It is a 2-port device fitted with two female SMA connectors. It is designed to have a pass-region centred around 1950 MHz. To ease connection and enable it to be measured as an insertable device, it was fitted with some right-angled SMA connectors (male-to-female on port 1 and male-to-male on port 2).

For the measurements of the band-pass filter, the frequency settings for the calibration were set to give a start frequency of 1560 MHz, a stop frequency of 2160 MHz and 201 measurement points at an IF Bandwidth of 100 Hz. The resultant frequency step was 3 MHz. Once calibration was complete, the band-pass filter (as DUT) was connected with its female end connected to Port 1 of the PicoVNA and its male end to Port 2.
The S11 and S21 measurement results utilizing each of the three calibration schemes are shown in Figure 5. In addition, Figure 6 presents a zoomed-in view (i.e. using a more sensitive scale) of the S21 results for the filter’s pass band. As before, there is very good agreement between the results produced by the three cal schemes for both the transmission and reflection parameters.


The comparison results for both devices – Pico Technology check standard and band-pass filter – indicate that the E-Cal unit is just as effective as a calibration device compared with the traditional mechanical calibration methods.
Comparison with national standards
NPL’s Primary Impedance Microwave Measurement System (PIMMS) is the UK’s national reference for all S-parameter measurements. As such, it is the most accurate and reliable source of such measurements in the UK [7, 8]. It is also an established internationally leading measurement capability, as demonstrated by performance documented in the Key Comparison Database maintained by the International Bureau of Weights and Measures (BIPM) [5].
PIMMS offers traceable S-parameter measurements for both national and international customers. PIMMS typically provides measurements of VNA calibration and verification kits in order to provide customers with measurement traceability to the international system of units (SI). It provides measurements of devices in a wide range of coaxial connector sizes and waveguide bands at RF, microwave and millimetre-wave frequencies. By comparing E-Cal measurements with PIMMS measurements, the performance of the E-Cal can be verified against the most accurate measurements available anywhere in the world. PIMMS operates by measuring the DUTs using a VNA that is configured with an external TRL (Thru-Reflect-Line) calibration algorithm [9], implemented by NPL, using calibration items traceable to basic SI units, via their mechanical properties, in order to produce S-parameter measurements with known uncertainties.
For this comparison, the measurements performed by the Pico VNA calibrated with the E-Cal unit were compared with the results from PIMMS. This provides a rigorous test for the E-Cal unit as its performance is compared directly against a state-of-the-art international S-parameter measurement capability.
The first device for this comparison was a Hewlett Packard 20 dB attenuator, as shown in Figure 7. This device is fitted with 3.5 mm connectors, which are mechanically compatible with SMA connectors albeit with a small electrical discontinuity at the connectors’ interface [10]).
The measurements of the S22 reflection parameter of this 20 dB attenuator are compared in Figure 8. The frequency-dependent uncertainties for the PIMMS measurements are represented by
black vertical “error bars” at each frequency point. These uncertainties are “standard uncertainties” (i.e. at the 1σ level) calculated using the law of propagation of uncertainties [11]. The rise in uncertainty at around 4.7 GHz is due to the magnitude of the measured reflection becoming quite small.

The inevitable mismatch due to the differing connector interfaces of the two systems (i.e. the PicoVNA provides an SMA-to-3.5 mm interface, whereas PIMMS provides a 3.5 mm-to-3.5 mm interface) means that some level of disagreement is to be expected. Reference [10] states that this mismatch can be as high as 8 mU (linear magnitude) at 5 GHz. However, it can be seen that, across the full frequency band, the results from the E-Cal unit almost entirely fall within the 1σ uncertainty intervals of the PIMMS measurements. This represents very good agreement between the E-Cal and PIMMS measurements.

Measurements of the transmission parameters of the Pico Technology check standard [6] are compared in Figures 9 and 10.

As before, the uncertainties for the PIMMS results are represented by black vertical error bars at each frequency point. On this occasion, these uncertainties represent 95% confidence intervals. The results from the E-Cal unit generally fall within the uncertainty limits for the PIMMS measurements. This again shows very good agreement between the E-Cal and PIMMS measurements.
The very good agreement between the E-Cal and PIMMS measurements demonstrates that the results produced by the E-Cal unit are equivalent to the PIMMS results, which, in turn, indicates the international equivalence of the E-Cal measurements.
Conclusions
This paper has described a benchmarking exercise for a new electronic calibration (E-Cal) unit designed specifically for use with the Pico Technology USB-enabled 8.5 GHz VNA. The E-Cal unit has been used to calibrate the VNA and the results have been compared with results obtained using traditional mechanical calibration methods. The level of agreement was found to be very good – it was not possible to distinguish the E-Cal results from results obtained using traditional calibration methods. This demonstrates that the E-Cal unit can be used, without any loss of accuracy, in applications where previously mechanical calibration methods have been used.
In addition, results from the Pico VNA calibrated with the E-Cal unit have been compared against the UK national standard (PIMMS) which is recognised throughout the world as a leading capability for these types of measurements. Again, the level of agreement was very good – the Pico E-Cal results were generally within the uncertainty limits of the PIMMS measurements, thus demonstrating international equivalence of the results obtained using the E-Cal unit.
In summary, the overall outcome from this benchmarking exercise has been to successfully demonstrate that high measurement accuracy is achievable using the new E-Cal unit. This is good news for end-users wanting quick, easy to implement methods for obtaining accurate measurements from portable USB-enabled VNAs via automatic electronic calibration.
Acknowledgement
The work described in this paper was funded by the UK government’s Department for Business, Energy, and Industrial Strategy (BEIS) as part of its “Measurement for Recovery” programme.
References
[1] N M Ridler and N Nazoa, "Using simple calibration load models to improve accuracy of vector network analyser measurements", 67th Automatic RF Techniques Group (ARFTG) conference digest, pp 104-110, San Francisco, California, USA, 16 June 2006.
[2] A Rumiantsev and N M Ridler, "VNA calibration", IEEE Microwave Magazine, Vol 9, No 3, pp 86-99, June 2008.
[3] V Adamian, “A Novel Procedure for Network Analyser Calibration and Verification”, 41st ARFTG conference digest, pp 8-17, Atlanta, Georgia, USA, 18 June 1993.
[4] PicoVNA Dual E-Cal 8.5 GHz Automated calibration kit (SMA) ).
[5] BIPM, Key Comparison Database: Calibration and Measurement Capabilities, .
[6] Pico Technology, “CHK-INS-MF Insertable check standard SMA(m-f)”.
[7] N M Ridler, "A review of existing national measurement standards for RF and microwave impedance parameters in the UK", IEE Colloquium Digest, No 99/008, pp 6/1-6/6, February 1999.
[8] N M Ridler, “News in RF impedance measurement”, XXVIIth General Assembly of the International Union of Radio Science (URSI), paper no 437, session A1, Maastricht Exhibition and Congress Centre (MECC), The Netherlands, 17-24 August 2002.
[9] G F Engen and C A Hoer, “Thru-Reflect-Line: An improved technique for calibrating the dual six-port automatic network analyser”, IEEE Trans Microwave Theory & Techniques, Vol 27, No 12, pp 987-993, December 1979. {this is the TRL reference}
[10] J P Ide, “Estimating the electrical compatibility of mechanically compatible connectors”, Microwave Engineering Europe, pp 39-43, August/September 1994.
[11] JCGM-100, “Guide to the expression of uncertainty in measurement”, International Bureau of Weights and Measures, 1st edition, September 2008.